 and
and 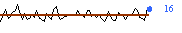 -- sparkline the bank's account opening activity during a given period. Well, have achieved it roughly, anyway. But generating sparklines is a big hassle: code for Office 2000 or XP and above? (2000 doesn't have a feature which makes the user's life a hell of a lot easier.) When generating multiple sparklines at the same time, scale them all to the same scale or different (as they are above)? Currently I'm coding for MSO2000, though there's no guarantee the code will actually work; and scaling to different scales even when generating in the same batch. Will have to change both these settings because the alternatives are so much more helpful.
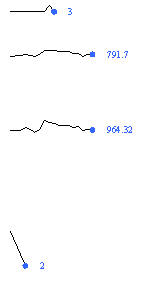
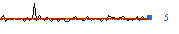
On the plus side, wrote a clever little toolbar that manages generated sparklines -- i.e. selecting and deleting them -- almost well enough to be called a sparkline manager.
Here are the macros that pull in and parse the plain-text reports generated daily by the bank's software:
Sub inputData(fname, aDoc)
  Set fso = CreateObject("Scripting.FileSystemObject")
  Set fin = fso.OpenTextFile(fname, 1)
  branchNamesStore = ""
  openingCountsStore = ""
  printingCounts = False
  weHaveTabs = False

  Do While fin.AtEndOfStream <> True
      aLine = fin.ReadLine

      Dim branchNamePoses(5)
      branchNamePoses(0) = InStr(1, aLine, " BRANCH       ")
      branchNamePoses(1) = InStr(1, aLine, " BRANCH" + vbTab)
      branchNamePoses(2) = InStr(1, aLine, " BRAN       ")
      branchNamePoses(3) = InStr(1, aLine, " BRAN" + vbTab)
      branchNamePoses(4) = InStr(1, aLine, " BRANC      ")
      branchNamePoses(5) = InStr(1, aLine, " BRANC" + vbTab)

      numAcctsPos = InStr(1, aLine, "OPENED :")
      lineHasComma = InStr(1, aLine, ",")
      branchName = ""
      branchNameTemp = ""
      numAcctsStr = ""

      For posCounter = 0 To UBound(branchNamePoses)
          If branchNamePoses(posCounter) <> 0 And lineHasComma = 0 Then
              If posCounter Mod 2 = 0 Then ' No tabs in this file
                  i = branchNamePoses(posCounter) - 1
                  Do While Mid(aLine, i, 1) <> " "
                      branchName = branchName & Mid(aLine, i, 1)
                      i = i - 1
                  Loop
                  branchNameTemp = branchName
                  branchName = StrReverse(branchNameTemp)
                  branchNamesStore = branchNamesStore & " " & branchName
              Else ' Tabs in the file
                  weHaveTabs = True
                  i = branchNamePoses(posCounter) - 1
                  Do While Mid(aLine, i, 1) <> vbTab
                      branchName = branchName & Mid(aLine, i, 1)
                      i = i - 1
                  Loop
                  branchNameTemp = branchName
                  branchName = StrReverse(branchNameTemp)
                  branchNamesStore = branchNamesStore & " " & branchName
              End If
          ElseIf InStr(1, aLine, "HEAD OFFICE") And lineHasComma = 0 And Not InStr(1, branchNamesStore, "HEADOFFICE") Then
              branchNamesStore = branchNamesStore & " HEADOFFICE"
              Exit For
          End If
      Next posCounter

      If numAcctsPos <> 0 Then
          i = numAcctsPos + 9
          Do While i < Len(aLine) + 1
              curChar = Mid(aLine, i, 1)
              If weHaveTabs Then
                  If curChar <> vbTab Then numAcctsStr = numAcctsStr & curChar
              Else
                  If curChar <> " " Then
                      numAcctsStr = numAcctsStr & curChar
                  Else
                      If Len(numAcctsStr) >= 2 Then Exit Do
                  End If
              End If
              i = i + 1
          Loop
          openingCountsStore = openingCountsStore & " " & numAcctsStr
      End If
  Loop
  fin.Close

  branchNames = Strings.Split(Trim(branchNamesStore))
  openingCounts = Strings.Split(Trim(openingCountsStore))
  Debug.Assert UBound(branchNames) = UBound(openingCounts)

  For Each par In aDoc.Paragraphs
      docLine = Mid(par.Range.Text, 1, Len(par.Range.Text) - 1)
      If docLine = "\begin{acc_opening_counts}" Then
          printingCounts = True
          GoTo nextItem
      ElseIf docLine = "\end{acc_opening_counts}" Then
          printingCounts = False
          GoTo nextItem
      End If

      typedNumber = False
      If printingCounts Then
          curBranch = Trim(par.Range.Words.First)
          par.Range.Select
          Selection.EndKey Unit:=wdLine
          For i = 0 To UBound(branchNames)
              If branchNames(i) = curBranch Then
                  typedNumber = True
                  Selection.TypeText Text:=" " & openingCounts(i)
                  GoTo nextItem
              End If
          Next i
          If typedNumber = False Then Selection.TypeText Text:=" 0"
      End If
nextItem:
  Next
End Sub

Sub importStats()
  Dim theDoc As Document
  Set theDoc = ActiveDocument

  Set fso = CreateObject("Scripting.FileSystemObject")
  monthFolder = "\\accounts\MB_REPORT 2004\YEAR2004\DECEMBER2004\"

  For i = 1 To 31
      If i < 10 Then
          fname = monthFolder + "Dhanmondi Branch  2004-12-0" & Str(i) & "\AC_OPEN_ALL"
          fname = Strings.Replace(fname, "0 ", "0")
          If fso.FileExists(fname) Then
              inputData fname, theDoc
          Else
              Debug.Print fname, "does not exist"
          End If
      Else
          fname = monthFolder + "Dhanmondi Branch  2004-12-" & i & "\AC_OPEN_ALL"
          If fso.FileExists(fname) Then
              inputData fname, theDoc
          Else
              Debug.Print fname, "does not exist"
          End If
      End If
  Next i
End Sub
May not look like much but was a bitch to write thanks to the lack of regular expressions in vanilla Office VBA. This was the first half. The second half was even harder because even more ill-defined -- almost no one's ever done it before.
The sparkline generator:
Microsoft Word Object ThisDocument
Private Sub Document_Close()
  myDocumentClose
End Sub

Private Sub Document_Open()
  myDocumentOpen
End Sub
Module NewMacros
Function sizeof(arr)
  sizeof = UBound(arr) - LBound(arr)
End Function

Function sort(arr As Variant, Optional SortAscending As Boolean = True)
  ' Chris Rae's VBA Code Archive - http://chrisrae.com/vba
  ' By Chris Rae, 19/5/99. My thanks to
  ' Will Rickards and Roemer Lievaart
  ' for some fixes.
  ToSort = arr
  Dim AnyChanges As Boolean
  Dim BubbleSort As Long
  Dim SwapFH As Variant
  Do
      AnyChanges = False
      For BubbleSort = LBound(ToSort) To UBound(ToSort) - 1
          If (ToSort(BubbleSort) > ToSort(BubbleSort + 1) And SortAscending) _
             Or (ToSort(BubbleSort) < ToSort(BubbleSort + 1) And Not SortAscending) Then
              ' These two need to be swapped
              SwapFH = ToSort(BubbleSort)
              ToSort(BubbleSort) = ToSort(BubbleSort + 1)
              ToSort(BubbleSort + 1) = SwapFH
              AnyChanges = True
          End If
      Next BubbleSort
  Loop Until Not AnyChanges
  sort = ToSort
End Function

Function arrayMin(theArr)
  Dim arr()
  ReDim arr(UBound(theArr))

  For i = LBound(theArr) To UBound(theArr)
      arr(i) = Val(theArr(i))
  Next i

  If sizeof(arr) = 1 Then
      arrayMin = arr(LBound(arr))
  ElseIf sizeof(arr) = 2 Then
      If arr(LBound(arr)) < arr(UBound(arr)) Then
          smaller = arr(LBound(arr))
      ElseIf arr(UBound(arr)) < arr(LBound(arr)) Then
          smaller = arr(UBound(arr))
      End If
      arrayMin = smaller
  Else
      sortedArr = sort(arr)
      arrayMin = sortedArr(LBound(sortedArr))
  End If
End Function

Function arrayMax(theArr)
  Dim arr()
  ReDim arr(UBound(theArr))

  For i = LBound(theArr) To UBound(theArr)
      arr(i) = Val(theArr(i))
  Next i

  If sizeof(arr) = 1 Then
      arrayMax = arr(LBound(arr))
  ElseIf sizeof(arr) = 2 Then
      If arr(LBound(arr)) < arr(UBound(arr)) Then
          bigger = arr(UBound(arr))
      ElseIf arr(UBound(arr)) < arr(LBound(arr)) Then
          bigger = arr(LBound(arr))
      End If
      arrayMax = bigger
  Else
      sortedArr = sort(arr)
      arrayMax = sortedArr(UBound(sortedArr))
  End If
End Function

Function scaleHeight(num, max, theHeight) As Double
  If max = 0 Then
      scaleHeight = 0
  Else
      scaleHeight = theHeight - (num / max) * theHeight
  End If
End Function

Function lineChart(aLine, theHeight, widthMul, showAvg, vertPos As Single, ByRef header, Optional ByVal scaleSame As Boolean, Optional scaleMax, Optional scaleMin)
  If Right(aLine, 1) = vbCr Then
      theLine = Left(aLine, Len(aLine) - 1)
  Else
      theLine = aLine
  End If
  theSeries = Split(theLine) ' Contains the header label
  Dim numSeries() ' Does not hold the label

  numNils = 0
  For counter = 1 To UBound(theSeries)
      If theSeries(counter) = "nil" Then numNils = numNils + 1
  Next counter

  ReDim numSeries(UBound(theSeries) - numNils - 1)
  For i = numNils + 1 To UBound(theSeries)
      numSeries(i - numNils - 1) = Val(theSeries(i))
  Next i

  If scaleSame Then
      min = scaleMin
      tempMax = scaleMax
  Else
      min = arrayMin(numSeries)
      tempMax = arrayMax(numSeries)
  End If
  max = tempMax - min

  For i = 0 To UBound(numSeries)
      tempNum = numSeries(i) - min
      numSeries(i) = tempNum
  Next

  If showAvg Then
      sum = 0
      For Each elem In numSeries
          sum = sum + elem
      Next
      avg = sum / UBound(numSeries)
      avgHeight = scaleHeight(avg, max, theHeight)
  End If

  With ActiveDocument.shapes.BuildFreeform(msoEditingAuto, (numNils * widthMul) + 100, scaleHeight(numSeries(0), max, theHeight) + vertPos)
      For i = 1 To UBound(numSeries)
          .AddNodes msoSegmentLine, msoEditingAuto, ((numNils + i) * widthMul) + 100, scaleHeight(numSeries(i), max, theHeight) + vertPos
      Next i
      freeformName = .ConvertToShape.Name
  End With

  With ActiveDocument.shapes.AddShape(msoShapeOval, (numNils + i - 1) * widthMul - 2 + 100, scaleHeight(numSeries(i - 1), max, theHeight) + vertPos - 2, 4, 4)
      .Fill.Visible = msoTrue
      .Fill.Solid
      .Fill.ForeColor.RGB = RGB(51, 102, 255)
      .Line.ForeColor.RGB = RGB(51, 102, 255)
      dotName = .Name
  End With

  With ActiveDocument.shapes.AddTextbox(msoTextOrientationHorizontal, (numNils + i - 1) * widthMul + 5 + 100, scaleHeight(numSeries(i - 1), max, theHeight) + vertPos - 7.5, 50, 15)
      .TextFrame.TextRange.Text = strings.Trim(Str(numSeries(i - 1) + min))
      .TextFrame.TextRange.Font.Size = 8
      .TextFrame.TextRange.Font.Color = RGB(51, 102, 255)
      .Fill.ForeColor.RGB = RGB(255, 255, 255)
      .Line.Visible = False
      .Fill.Transparency = 1#
      textBoxName = .Name
  End With

  If showAvg Then
      With ActiveDocument.shapes.AddLine(numNils * widthMul + 100, avgHeight + vertPos, (numNils + i - 1) * widthMul + 100, avgHeight + vertPos)
          .Line.ForeColor.RGB = RGB(153, 51, 0)
          .Line.DashStyle = msoLineRoundDot
          avgLineName = .Name
      End With
  End If

  header = theSeries(0)
  If showAvg Then
      retval = Array(freeformName, dotName, textBoxName, avgLineName)
  Else
      retval = Array(freeformName, dotName, textBoxName)
  End If

  For Each elem In retval
      Debug.Print elem
  Next
  lineChart = retval
End Function

Sub selectChart()
  Dim ctl As CommandBarComboBox
  Set ctl = CommandBars("Sparklines").Controls(2)
  If ctl.ListCount < 1 Then Exit Sub

  lineArr = Split(ctl.List(ctl.ListIndex), ":")

  theNames = Split(Trim(lineArr(1)), ",")
  Dim shapeNames() As Variant
  ReDim shapeNames(UBound(theNames))
  For i = 0 To UBound(shapeNames)
      shapeNames(i) = theNames(i)
  Next i

  ActiveDocument.shapes.Range(shapeNames).Select
End Sub

Sub deleteChart()
  Dim ctl As CommandBarComboBox
  Set ctl = CommandBars("Sparklines").Controls(2)
  If ctl.ListCount < 1 Then Exit Sub

  selectChart
  Selection.Delete
  ctl.RemoveItem ctl.ListIndex
End Sub

Sub moveChartRight()
  Dim ctl As CommandBarComboBox
  Set ctl = CommandBars("Sparklines").Controls(2)
  If ctl.ListCount < 1 Then Exit Sub

  selectChart
  Selection.MoveRight
End Sub

Sub moveChartLeft()
  Dim ctl As CommandBarComboBox
  Set ctl = CommandBars("Sparklines").Controls(2)
  If ctl.ListCount < 1 Then Exit Sub

  selectChart
  Selection.MoveLeft
End Sub

Sub refresh()
  myDocumentClose
  myDocumentOpen
End Sub

Sub myDocumentOpen()
  CommandBars.Add(Name:="Sparklines", Temporary:=False).Visible = True

  With CommandBars("Sparklines")
      With .Controls.Add(Type:=msoControlButton, Temporary:=False)
          .Caption = "Line Chart..."
          .Style = msoButtonCaption
          .OnAction = "lineChartGui"
      End With
      .Controls.Add Type:=msoControlDropdown
      With .Controls.Add(Type:=msoControlButton, Temporary:=False)
          .Caption = "Select"
          .Style = msoButtonCaption
          .OnAction = "selectChart"
          .Enabled = True
      End With
      With .Controls.Add(Type:=msoControlButton, Temporary:=False)
          .Caption = "Delete"
          .Style = msoButtonCaption
          .OnAction = "deleteChart"
          .Enabled = True
      End With
      With .Controls.Add(Type:=msoControlButton, Temporary:=False)
          .Caption = "Refresh"
          .Style = msoButtonCaption
          .OnAction = "refresh"
          .TooltipText = "Clears names of all charts from the list, whether charts are still in document or not"
          .Enabled = True
      End With
  End With
End Sub

Sub myDocumentClose()
  Dim sl As CommandBar

  On Error Resume Next
  Set sl = CommandBars("Sparklines")
  If sl Then sl.Delete
End Sub

Sub lineCharts(theHeight, widthMul, showAvg)
  noTb = False
  Dim sl As CommandBar
  On Error GoTo makeToolbar
  Set sl = CommandBars("Sparklines")

continueWithTb:
  howMany = Selection.Range.Paragraphs.Count
  If howMany < 1 Then End

  lines = Split(Selection.Range.Text, vbCr)
  theHeader = ""
  For i = 0 To howMany - 1
      theShapes = lineChart(lines(i), theHeight, widthMul, showAvg, 100 + i * (theHeight + 15), theHeader)
      shapesStrTemp = ""
      For Each elem In theShapes
          shapesStrTemp = shapesStrTemp & "," & elem
      Next
      shapesStr = Right(shapesStrTemp, Len(shapesStrTemp) - 1)
      sl.Controls(2).AddItem theHeader & ":" & shapesStr
  Next i

  Exit Sub
makeToolbar:
  myDocumentOpen
  GoTo continueWithTb
End Sub

Sub lineChartGui()
  frmLineChart.Show
End Sub
Yup, very complicated. Hopefully will become simpler and simpler in future iterations. Sometimes wonder why I don't just switch to automating Excel charts.